
Understanding and Modeling NIH Research Grant Success Rates and the Impact of “Multiyear Funding”

This is a guest post from Jeremy M. Berg, who is currently Professor of Computational and Systems Biology at the University of Pittsburgh. Berg received his B.S., M.S., and Ph.D. degrees in chemistry. He started as an Assistant Professor of Chemistry at Johns Hopkins University in 1986. He moved to the Johns Hopkins School of Medicine as Director of the Department of Biophysics and Biophysical Chemistry in 1990. In 2003, he became Director of the National Institute of General Medical Sciences (NIGMS) at NIH. He served at NIGMS until July 2011 when he moved with his wife Wendie Berg, M.D., Ph.D., a leading breast imaging researcher, to the University of Pittsburgh. Berg served as Editor-in-Chief of the Science family of journals from 2016-2019.
He has some thoughts about how often proposals succeed, and what will happen with the current move towards funding multi-year grants upfront rather than year-by-year.
Understanding and Modeling NIH Research Grant Success Rates and the Impact of “Multiyear” Funding
The National Institutes of Health funds the majority of the biomedical research in the United States. Perhaps the two most important parameters regarding NIH funding for researchers are the size of the NIH appropriation and the grant success rate (the probability of having a grant proposal funded). How are these two parameters related?
The NIH appropriation (in nominal dollars) over time is shown here.
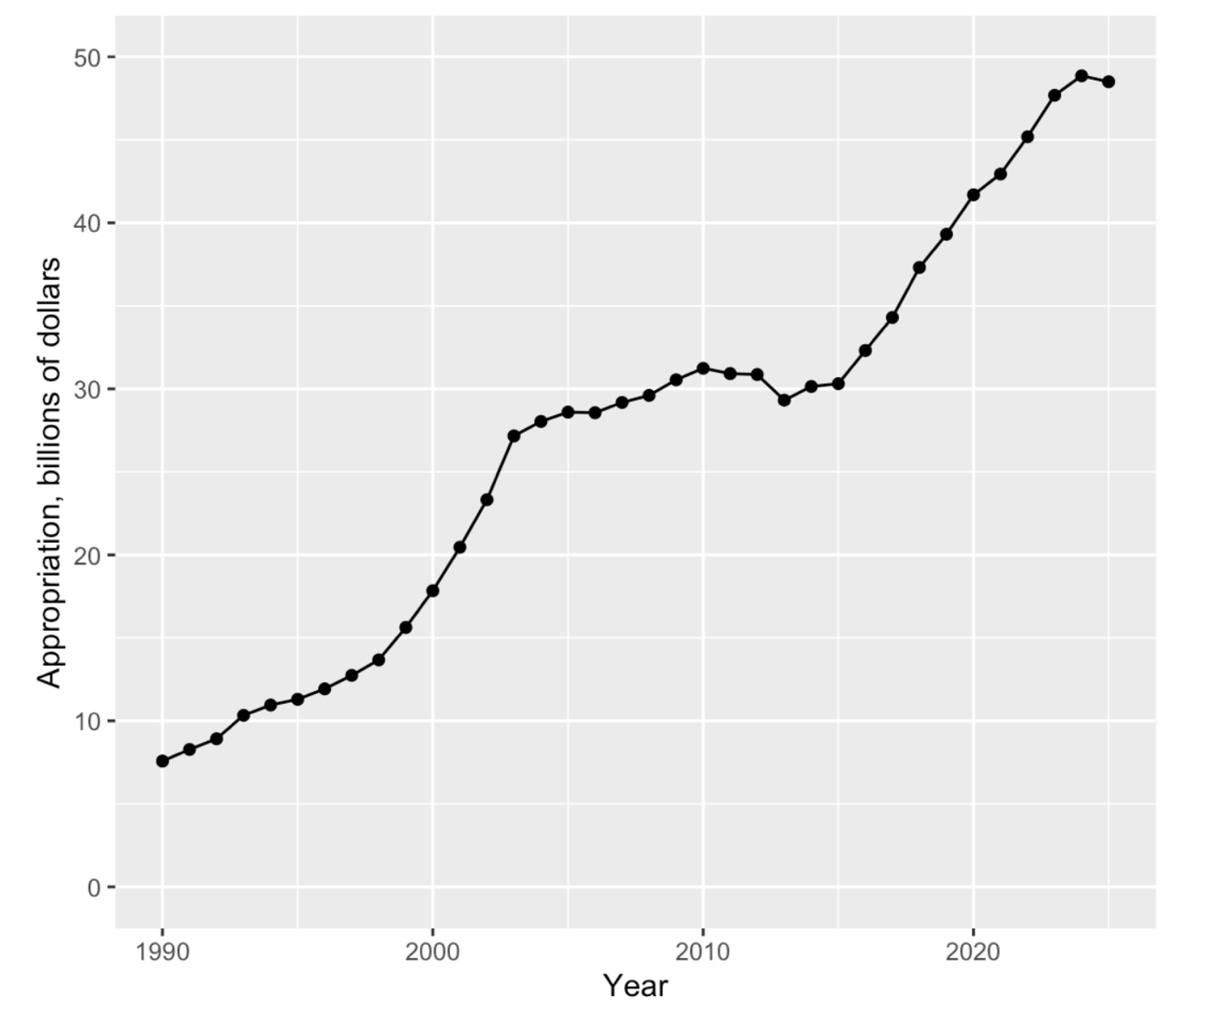
This graph reveals the NIH budget “doubling” from 1998 to 2003, followed by a period of relatively flat funding, followed by steady, but more modest, increases starting in 2016.
For comparison, the success rates for Research Project Grants are shown here:
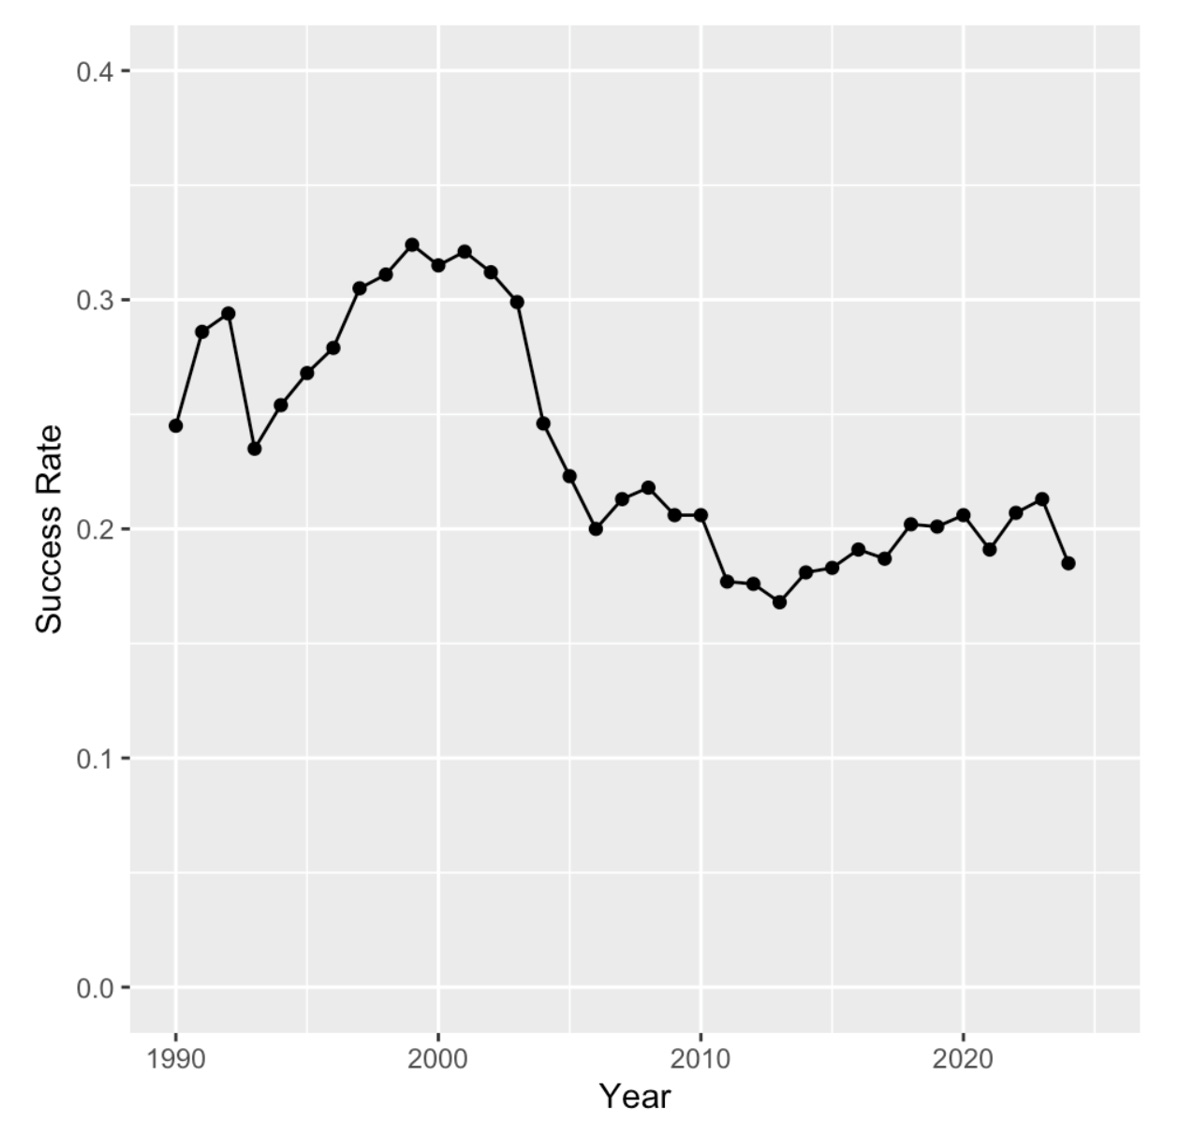
The success rate is defined as the number of competing grant applications funded divided by the number of applications reviewed in the same fiscal year.
The success rate did increase somewhat during the “doubling” but then it plummeted from > 0.30 (30%) to at or below 0.2 (20%) within a couple of years after the doubling ended. It has remained close to this level ever since, even with the increases in appropriation over the past decade.
Overall, these two parameters are negatively correlated with a Pearson correlation coefficient of -0.69.
Because NIH has increased grant sizes to correct for inflation (at least to some extent), one obvious adjustment is using the NIH appropriation in constant, rather than nominal, dollars. Corrections are made using the Biomedical Research and Development Price Index (BRDPI) rather than simple consumer inflation indices. The NIH appropriation in constant 1990 dollars is compared with that in nominal dollars below:
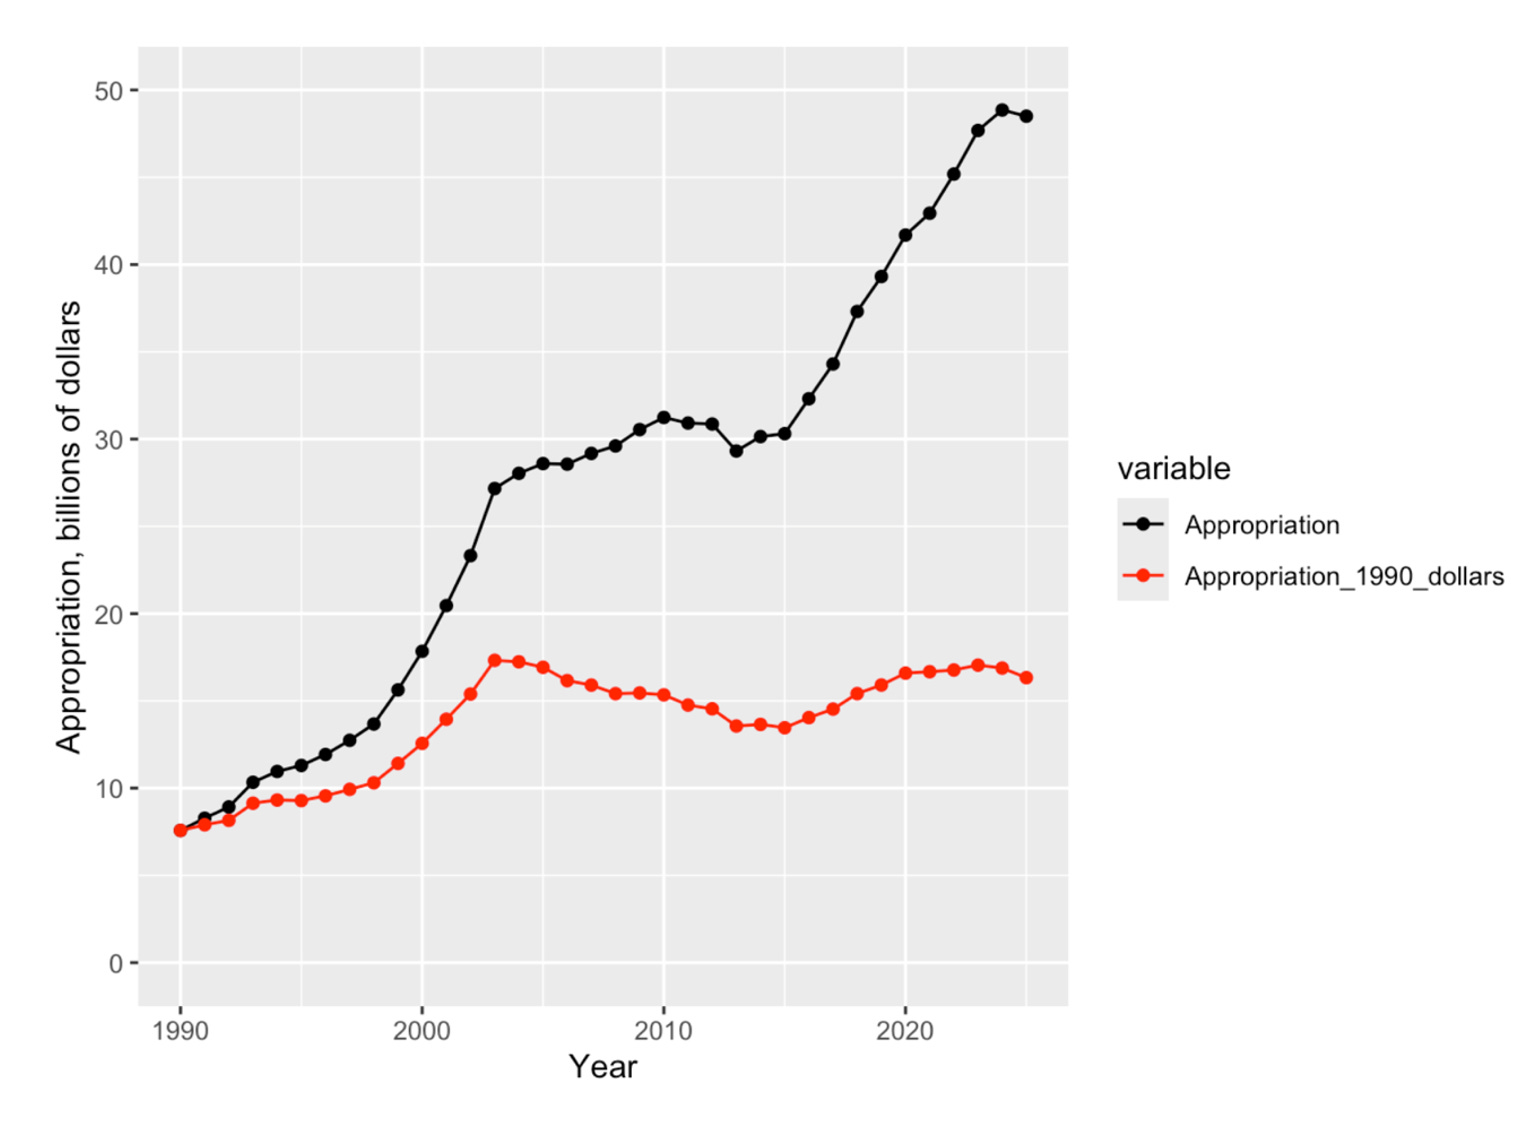
This graph reveals that the NIH appropriation in constant dollars actually peaked in 2003, dropped for about a decade, and then recovered almost back to the 2003 level.
The appropriation in constant dollars is still negatively correlated with the success rate data, but the correlation coefficient is somewhat less negative at -0.49.
The other key factor is the number of applications submitted and reviewed each year. These data are shown below:
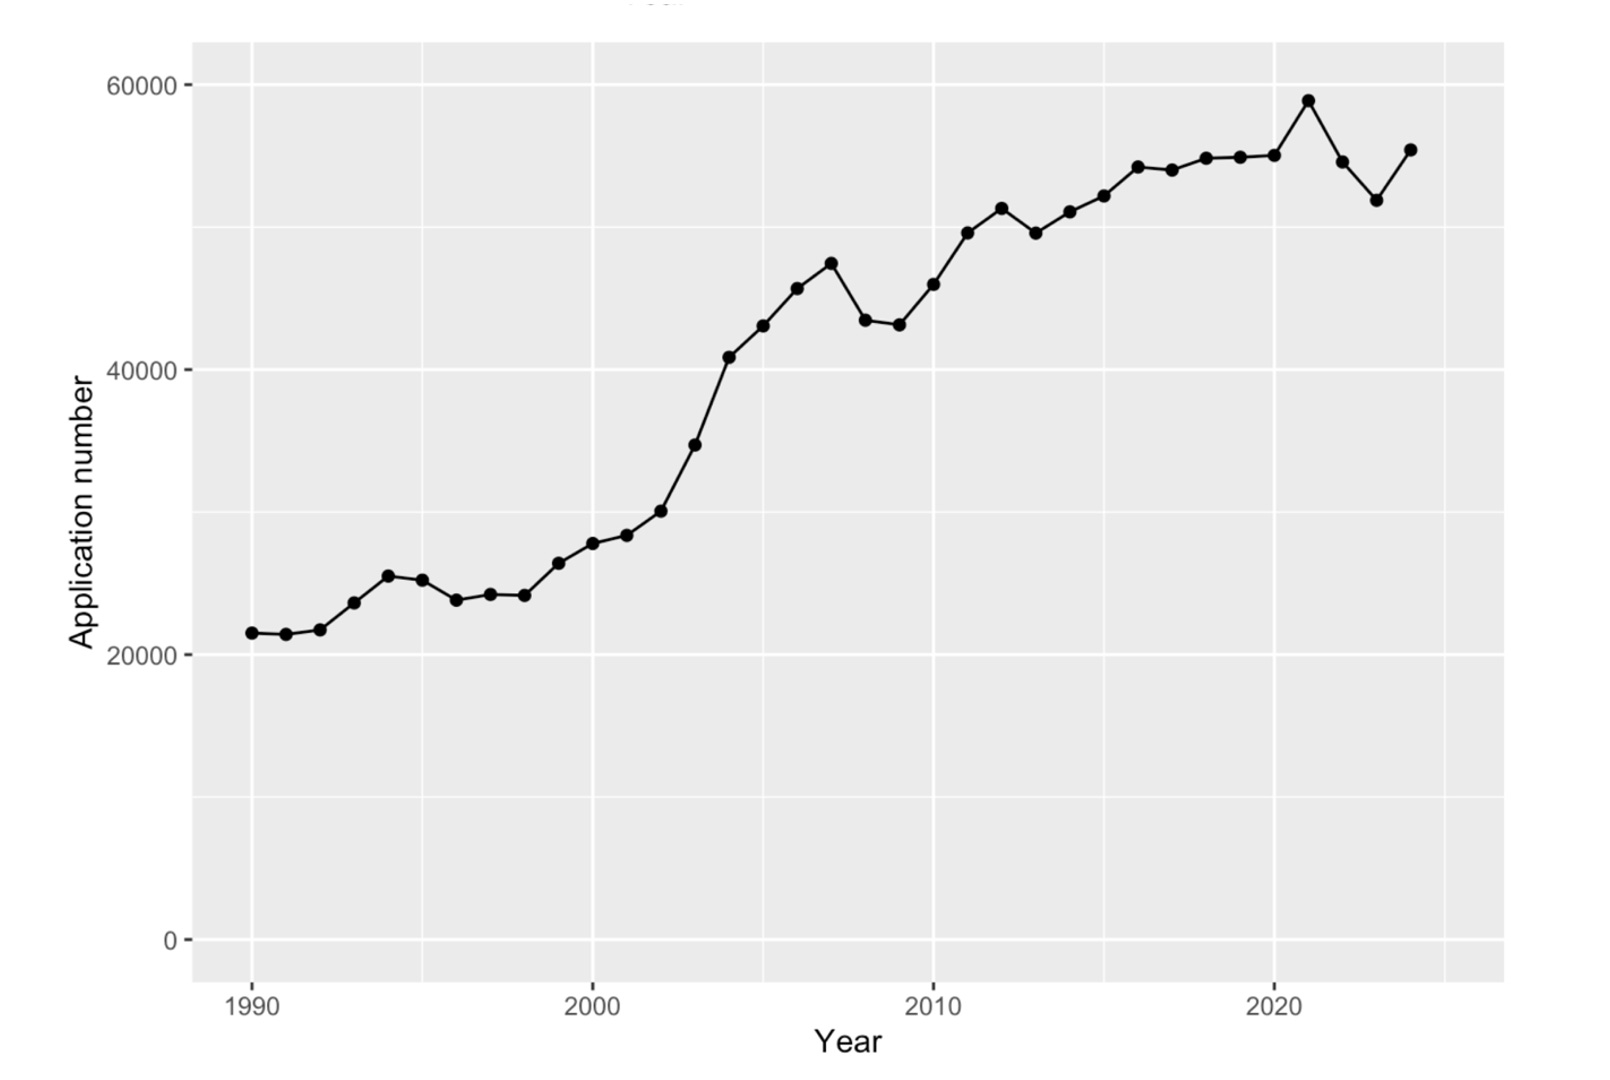
This shows that the number of applications grew fairly steadily, and grew especially dramatically, not during the “doubling” but just after the doubling ended.
Not surprisingly, these two factors, the inflation-corrected NIH appropriation and the number of competing applications reviewed, account for the observed success rates with a correlation coefficient between the ratio of the inflation-corrected appropriation to the number of application and the observed success rates of +0.89.
A Model for Predicting Success Rates from Appropriations Data
While it is possible to make good estimates of the success rate given the appropriation (inflation-corrected) and the number of applications, the latter information is not available until NIH releases it well into the next fiscal year and, at that point, the success rate is also available.
It would be desirable to have a way of estimating the likely success rate given only the NIH appropriation, since that is the first parameter publicly available. Years ago, I developed such a model. Here, I describe that model and update it through fiscal year 2025.
The model has two components. The first deals with the number of applications expected in a given year. As noted above, the number of applications almost always increases over time but the increases tend to be larger a year or two after the rate of growth of the NIH appropriation decreases.
To capture this behavior, the number of applications was fit to a linear model based on the appropriations for the previous two years of the form:
Number_of_applications = c1*Appropriation_for_one_year_prior + c2*Appropriation_for_two_years_prior + c3
The expectation is that c1 would be negative and c2 would be positive to capture the fact that the rate of increase of the number of applications goes up after the growth in appropriations drops. Inflation-corrected appropriation values were used.
The number of applications predicted from this model is compared with the actual number of applications below:
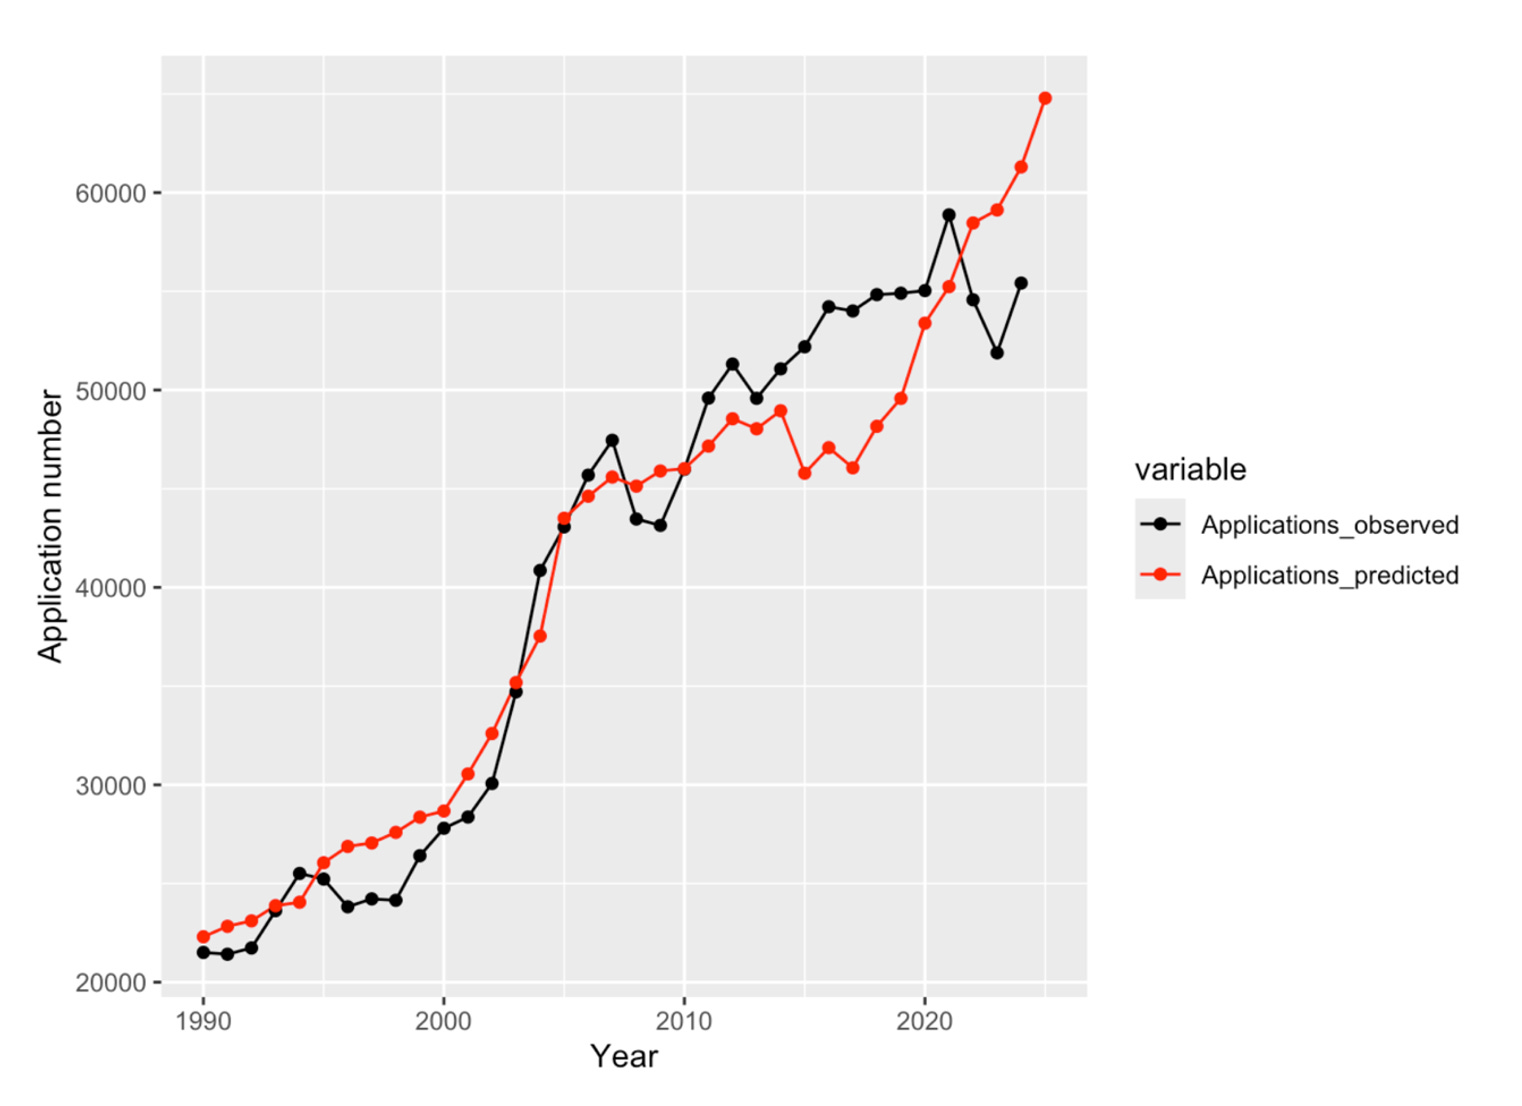
The agreement is reasonable although the predicted and observed curves differ from one another more starting around fiscal year 2015. The model predicts large increases in applications starting in fiscal year 2022 which have not occurred.
The use of more complicated linear models does not result in significantly better agreement with the number of applications observed over the range from 1990 to 2024.
The second component is the number of competitive grants funded each year. These data are available from NIH, some months after the end of each fiscal year. The results are shown below:
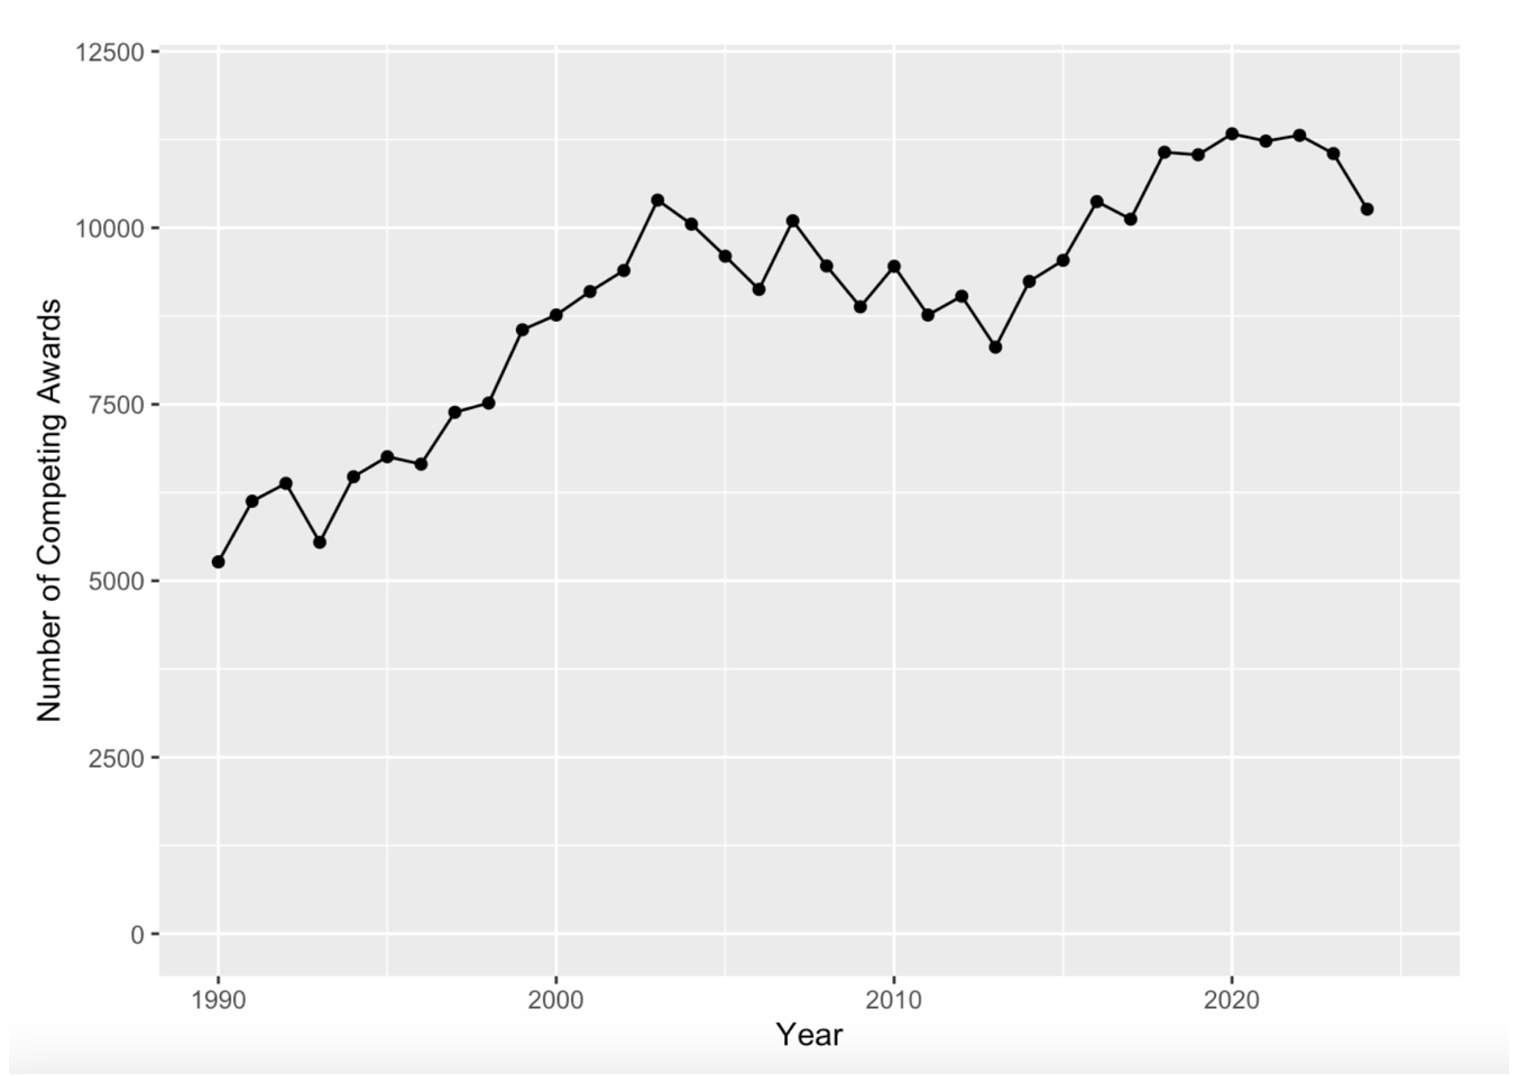
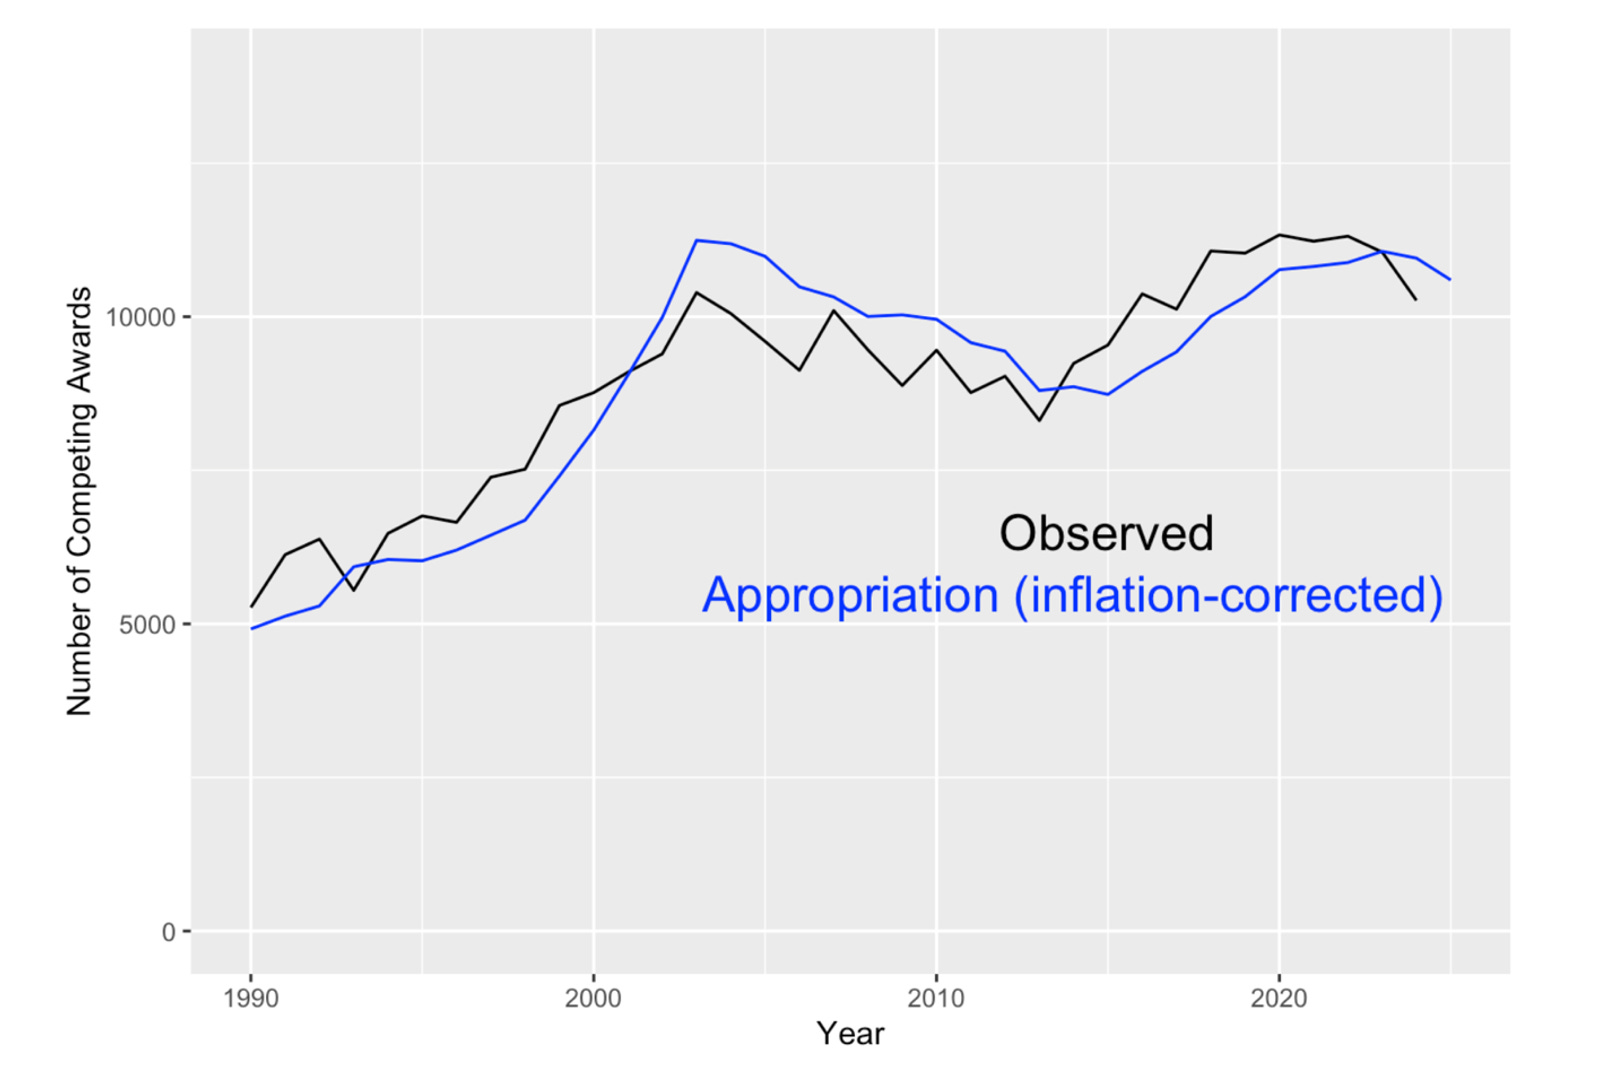
This curve is rather similar to the NIH Appropriation in constant 1990 dollars shown in Figure 3. This is not surprising since appropriated funds are necessary for making grant awards and NIH has made attempts (albeit sometimes unevenly) to have grant sizes keep up with inflation. These curves are compared directly in Figure 7.
Thus, the inflation-corrected appropriation should allow a reasonable estimate of the number of competing grants funded.
However, there is one additional correction that better reflects reality and improves the accuracy of the model. NIH historically funds grants on an annual basis. For example, when NIH issues a four-year grant, they only pay for the first year out of the current year’s appropriation but commits to pay the additional years of the grant out of subsequent year’s appropriations. In essence, for each multi-year grant funded, NIH takes out a mortgage for the subsequent years of the grant. The funds are tied up until the project period of the grant ends and then the funds are again available for new and competing grants. This is summarized in Figure 8.
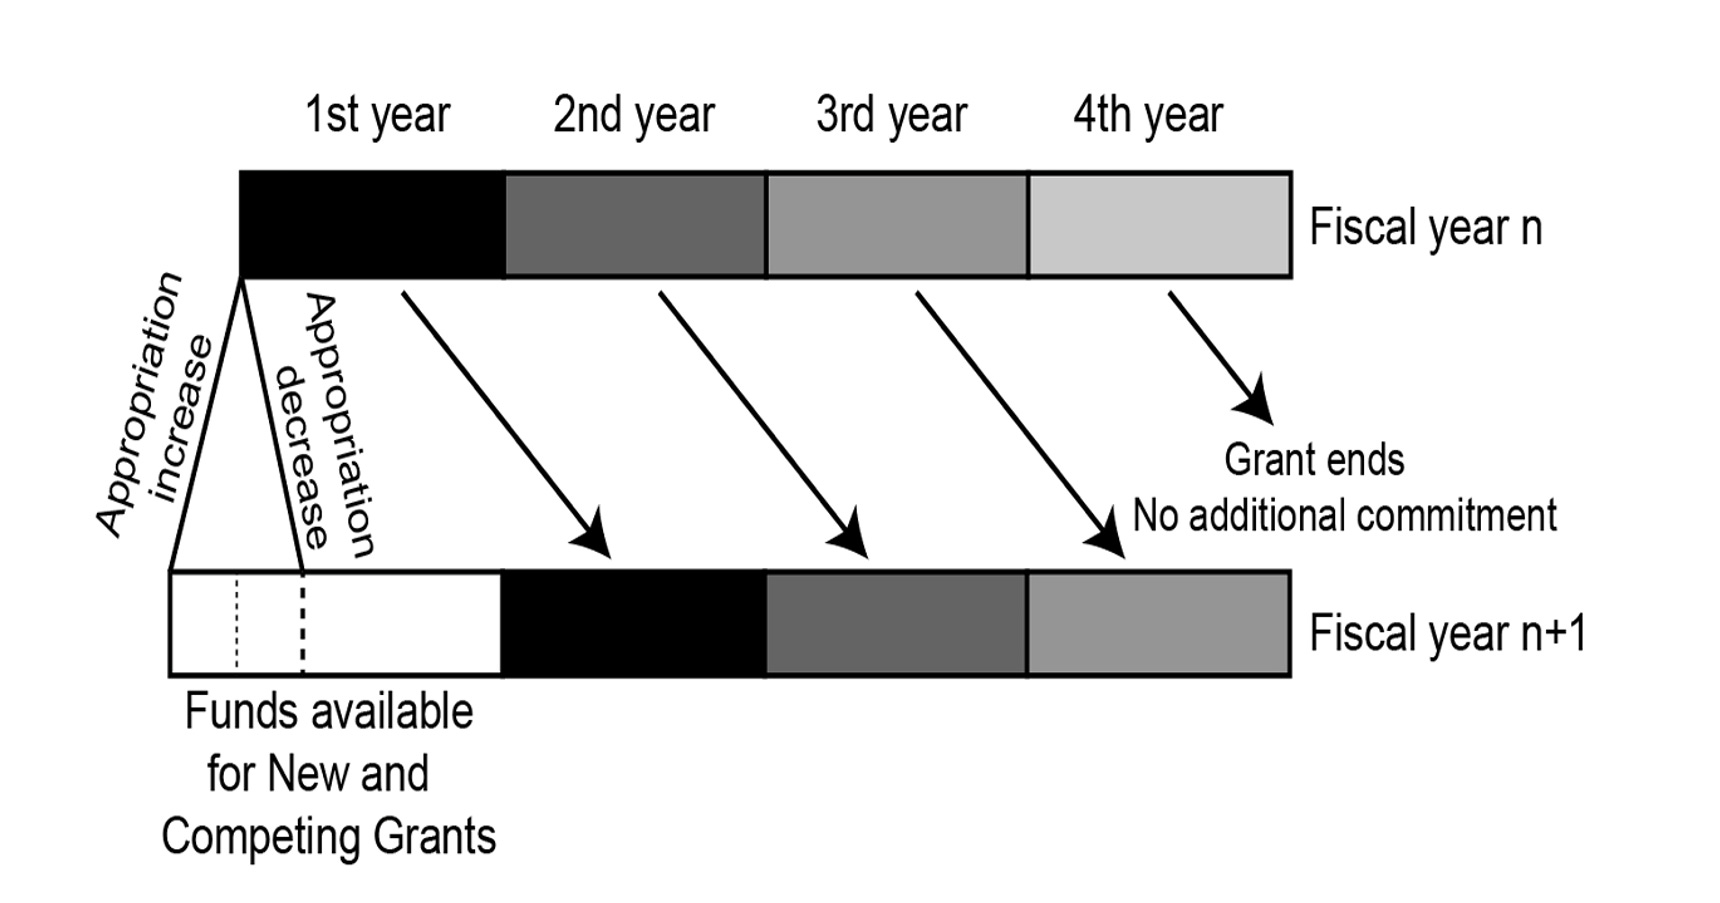
Thus, approximately 3/4th of the appropriated grants funds are already committed going into the beginning of a new fiscal year.
This phenomenon can be incorporated into a simple model that assumes that all grants are four years in duration and begins with an equal distribution of grants in each of the four years. The model then moves forward with new grants made based on the funds available from the new appropriation minus the amount of committed funds. The average grant size is assumed to increase with BRDPI inflation.
The results of this model are compared with those from the simpler, appropriation-based model in Figure 9.
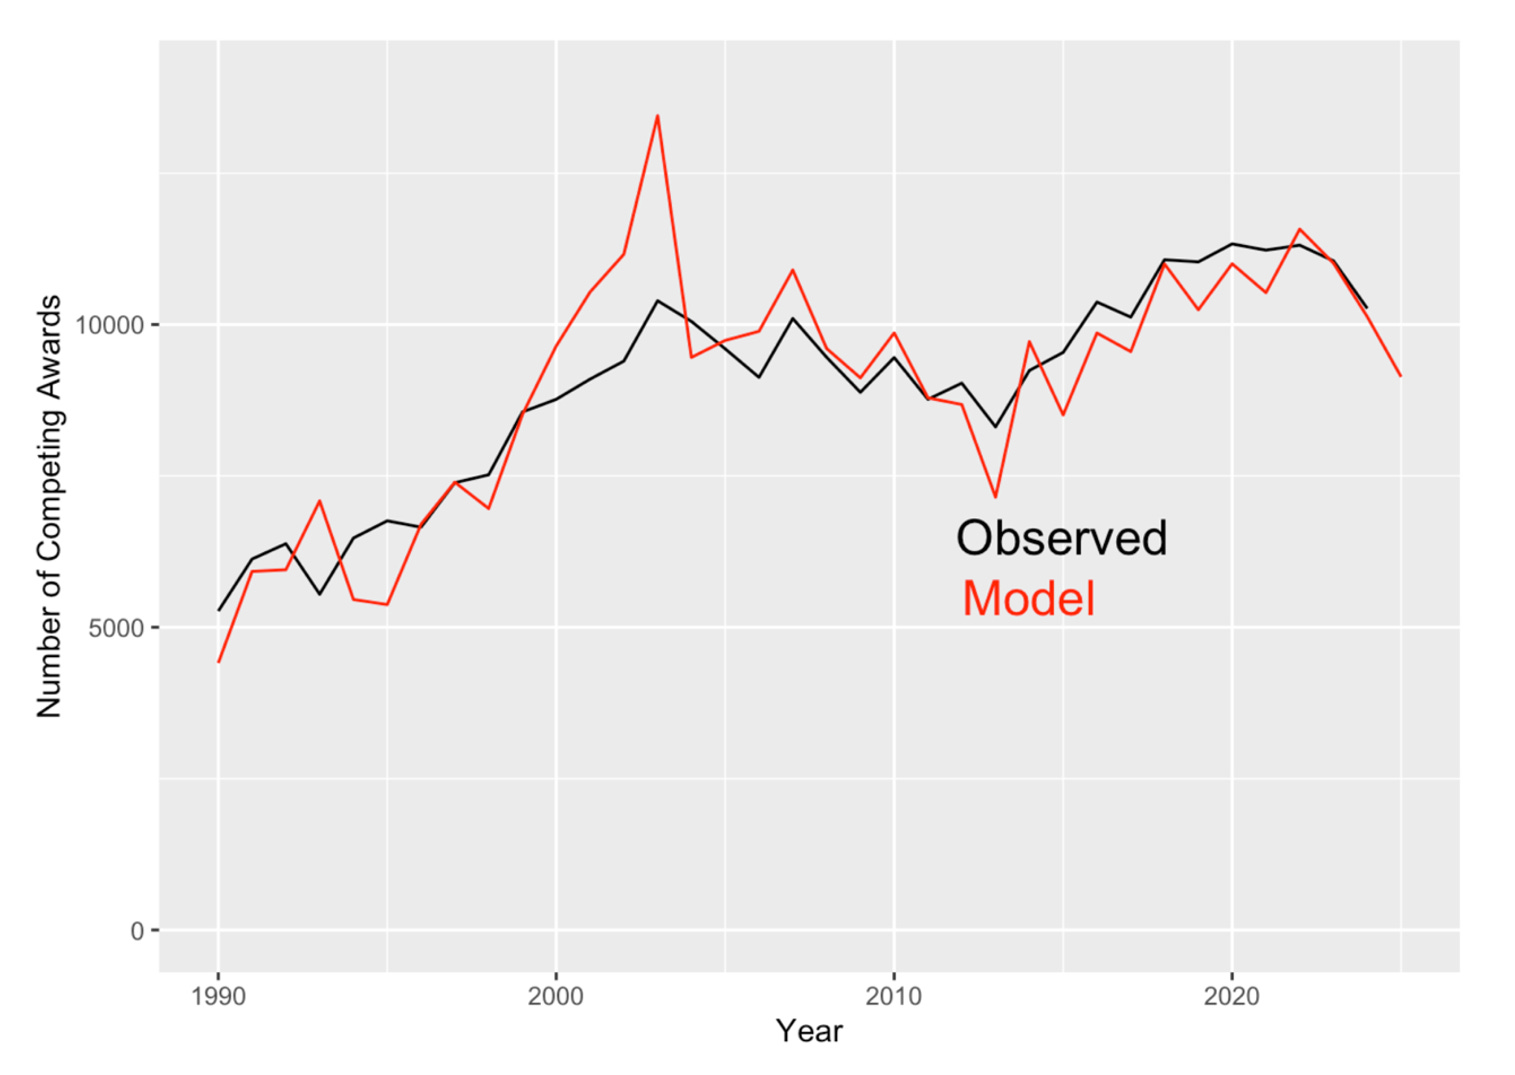
The model does remarkably well, capturing the small but important ups and downs from year to year. The biggest variance between the model and the actual number of awards made occurs during the period from 2000 to 2006, that is, from the middle of the budget doubling to a few years after its completion. This variance is due to programmatic changes made by the NIH starting in the middle of the doubling.
With additional funds available, many NIH institutes started new programs, generally involving larger team science efforts with mechanisms such as U54 cooperative agreements. These awards were often several million dollars each. These new programs allowed NIH to experiment with new approaches to supporting science and prevented grant success rates to rise well above historical norms that may have been deemed to be politically problematic.
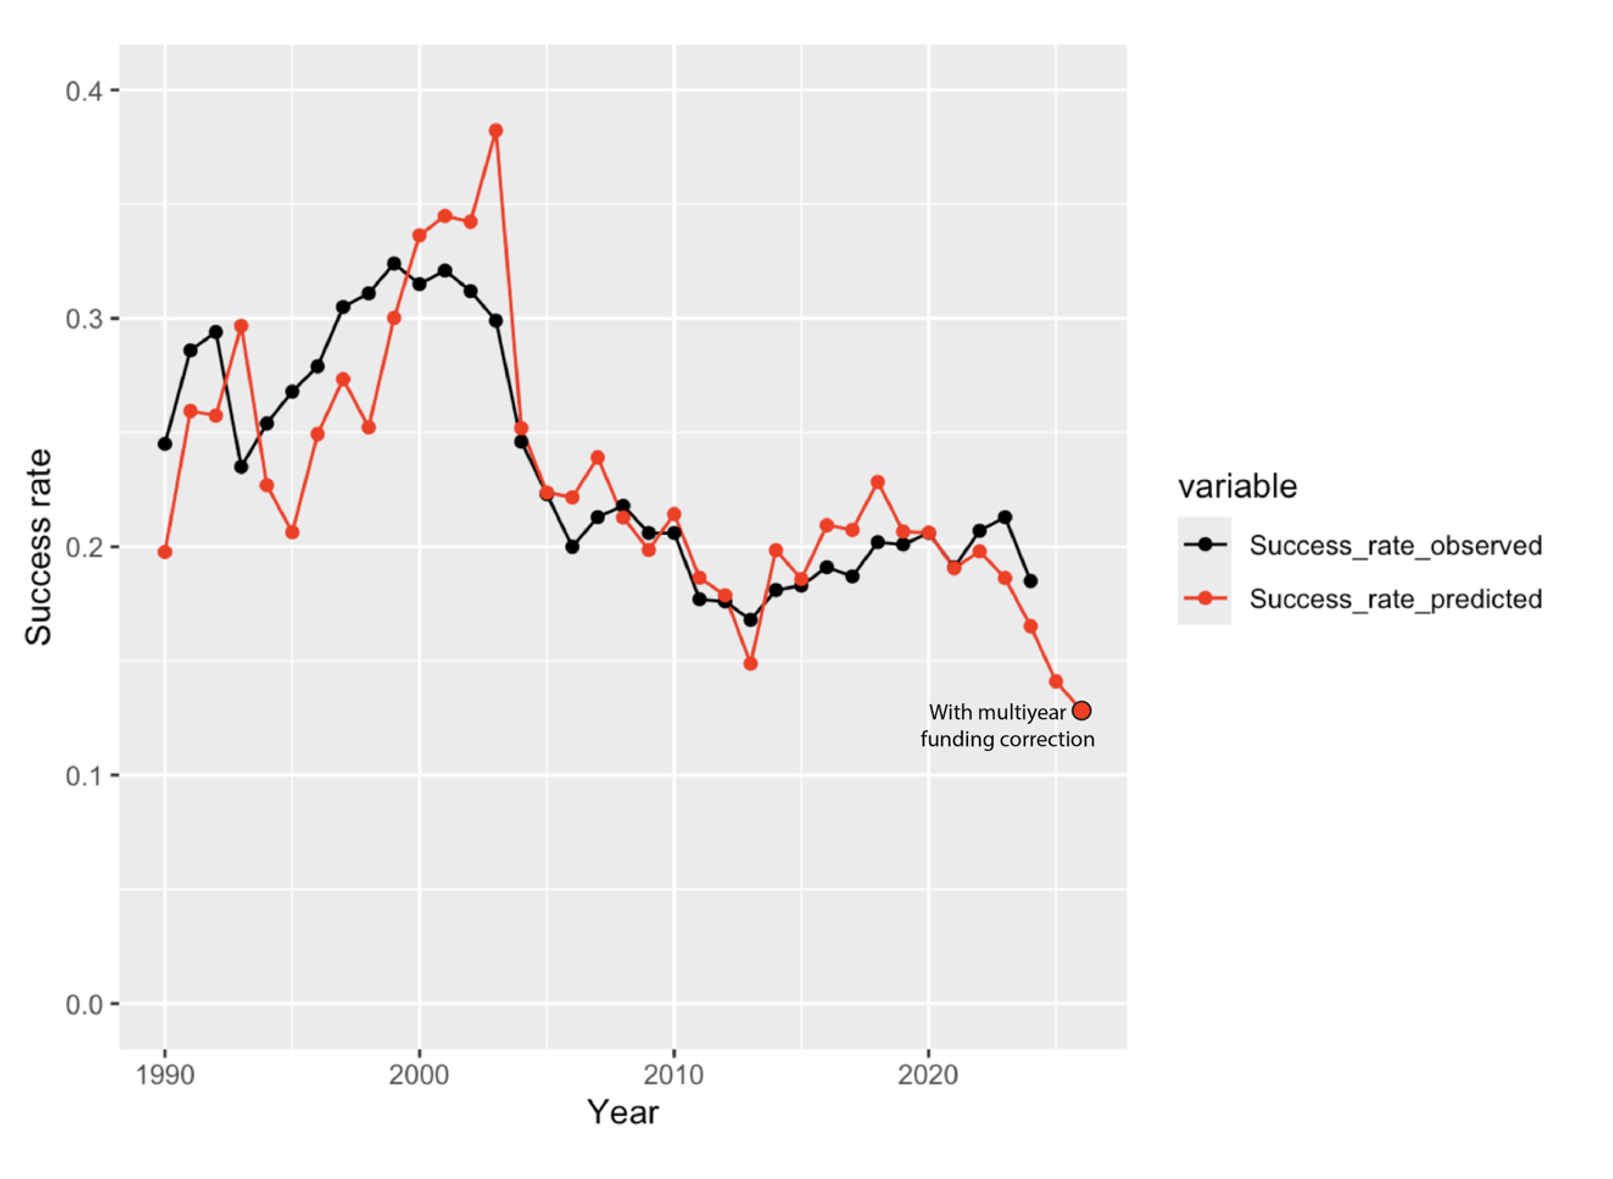
With models for the number of applications and the number of competing awards funded in hand, each based only on historical data about NIH appropriations and BRDPI inflation, we can now predict the research grant success rate. The results are shown in Figure 10.
The model does quite well, predicting the sharp drop in success rates following the NIH doubling and matching the smaller variations in subsequent years. The Peason correlation coefficient is 0.83. Overall, both the mean success rate (0.237 versus 0.236) and the standard deviation in success rates (0.050 versus 0.054) are predicted accurately.
This model is useful for predicting success rates once the appropriation for a new fiscal year is known. Moreover, if the observed result differs substantially from that from the model, then one should explore possible changes in policies and practices at NIH. Given the amount of turmoil at NIH over fiscal year 2025, it will be interesting to compare the actual results with those predicted from the model once NIH releases the official data. However, a recent change in policy that is anticipated in increase in importance in the current fiscal year must be considered.
Multiyear funding
As noted above, NIH generally funds grants on an incremental, annual basis. However, NIH has always “multiyear” or “fully funded” a small percentage of grants, taking all years of funding for the grant out of the appropriation for the year in which the grant is initially made. This practice was called out in the Congressional Justification for the fiscal year 2026 NIH budget, which included:
Traditionally, NIH research grants have been awarded for more than one year and funded incrementally; each year’s commitment is obligated from that year’s appropriation. Under this incremental funding approach, grants are classified as competing in the first year of award or renewal, and noncompeting in the remaining years of each award. Additionally, full funding has been provided up front for a limited number of grants and cooperative agreements as appropriate in special circumstances. Shifting to upfront funding for half of each year’s allocation for competing RPGs will increase NIH budget flexibility by no longer encumbering large portions of each year’s appropriation for the continuation of research projects that were initiated in previous years. As “legacy” noncompeting research projects phase out over the next few years, this shift in grants policy will make a greater portion of RPG funding available for new research projects each year.
As you can see from the discussion above, there is some truth to the argument about increasing budget flexibility. However, the transition from annual funding to multiyear funding creates problems. Suppose NIH funds a 4-year research grant using multiyear funding. This commits approximately 4 times as much funding as would have been committed had the grant been funded on traditional, annual basis. Thus, 3 other grants on the same size cannot be funded for each multiyear funded grant. This leads to a drop in the number of projects that can be funded with the corresponding drop in funded investigators.
The only real benefits to investigators and institutions from multiyear funding is that the funds can be spent faster if desired and there is no requirement for non-competitive renewal awards. However, these awards are historically awarded 98-99% of the time (and there are reasons when they are not) so this is not really much of a benefit and does give NIH less real oversight capabilities. The funds are not actually transferred from the treasury until they are spent, so there is a loss of cash flow to institutions as more spending authority sits in treasury accounts and not elsewhere.
It would be possible to responsibly manage the transition to multiyear funding by adding funds to the NIH appropriation during the transition years to pay for the potential loss of projects. But, it is noteworthy that the administration proposed this transition in the context of proposing a 40% cut in appropriations. This suggests that the rationale for multiyear funding is actually just a pretext for cutting funds to the extramural scientific enterprise and for other purposes, to be discussed below.
How much multiyear funding has been done in the past? Getting a clear definition of how NIH defines multi-year funding has not been straightforward. The simplest definition is that a grant in multiyear funded if the budget period is longer than 1 year. I use 12.1 months to avoid including grants that are a day or two longer than 1 year. An additional parameter of interest is the amount of funds committed beyond 1 year. This relates to the duration of multiyear funding grants. For example, the funds for 2-year multiyear funded grant could have been used to fund an annually funded grant of the same size whereas the funds for 4-year multiyear funded grant could have been used to fund three annually funded grants of the same size.
Let us first consider fiscal year 2024. The total amount of funded devoted to multiyear funded grants is $3.13B which represented 8.7% of the total NIH extramural commitments. Limiting consideration to new or competing grants, the total funds committed to multiyear funding grants was $1.40B which represented 16.2% of the total funds committed to new and competing grants. The percentage of funds committed beyond 1 year was 4.80% of the total extramural commitments.
We now turn to fiscal year 2025. The total amount of funded devoted to multiyear funded grants is $4.62B which represented 13.0% of the total extramural commitments. Limiting consideration to new or competing grants, the total funds committed to multiyear funding grants was $3.61B which represented 30.1% of the total funds committed to new and competing grants. The percentage of funds committed beyond 1 year was 7.75% of the total extramural commitments.
From these data, it is clear than NIH increased the amount of funds committed to multiyear funding for new and competitive grants by a substantial amount, more than a factor of 2 in terms of dollars and nearly a factor of 2 in terms of fraction of new and competing funding.
The differences are even more striking when examining grant mechanisms that were used for multiyear funding. In fiscal year 2024, the topic mechanisms (in terms of number of awards) were:
R21: 484
R15: 237
R03: 162
DP2: 108
RF1: 80
R01: 21
R35: 0
R21 and R03 grants are almost always 2 years in duration intended for projects limited in scope. R15 grants are 3-year grants intended to non-research-intensive institutions. DP2 grants are NIH Director New Innovator award which have generally been multiyear funded since they were created in the middle of a fiscal year when continued funding was not guaranteed. RF1 grants are explicitly a multiyear funding mechanism, implemented by administratively converting R01 grants. This mechanism has been largely used by the National Institute on Aging (NIA) in the context of rapidly growing appropriations. R01s are the “bread-and-butter” investigator-initiated research mechanism at NIH. R35 is a mechanism used primarily by the National Institute of General Medical Sciences (NIGMS) and the National Cancer Institute (NCI) for funding individual investigator’s research programs as opposed to projects.
For fiscal year 2025, the corresponding numbers are:
R21: 915
R15: 199
R03: 248
DP2: 102
RF1: 249
R01: 743
R35: 58
Most strikingly, the numbers of the bottom three “bread-and-butter” mechanisms increased from barely 100 to over 1000.
The Impact of Multiyear Funding
The previous model predicts that there would be 9,136 new and competitive renewal grants in fiscal year 2026. But, with the increased level of multiyear funding in fiscal year 2025, decreasing commitments, this number is increased to 9,751 with the assumption that no excess multiyear funding would occur in fiscal year 2026.
But, given that the administration has stated that it intends to use a substantial amount of multiyear funding, it is important to model the effects of this multiyear funding. For this purpose, we assume that multiyear funding includes an equal number of multiyear funded awards with durations of two years and four years.
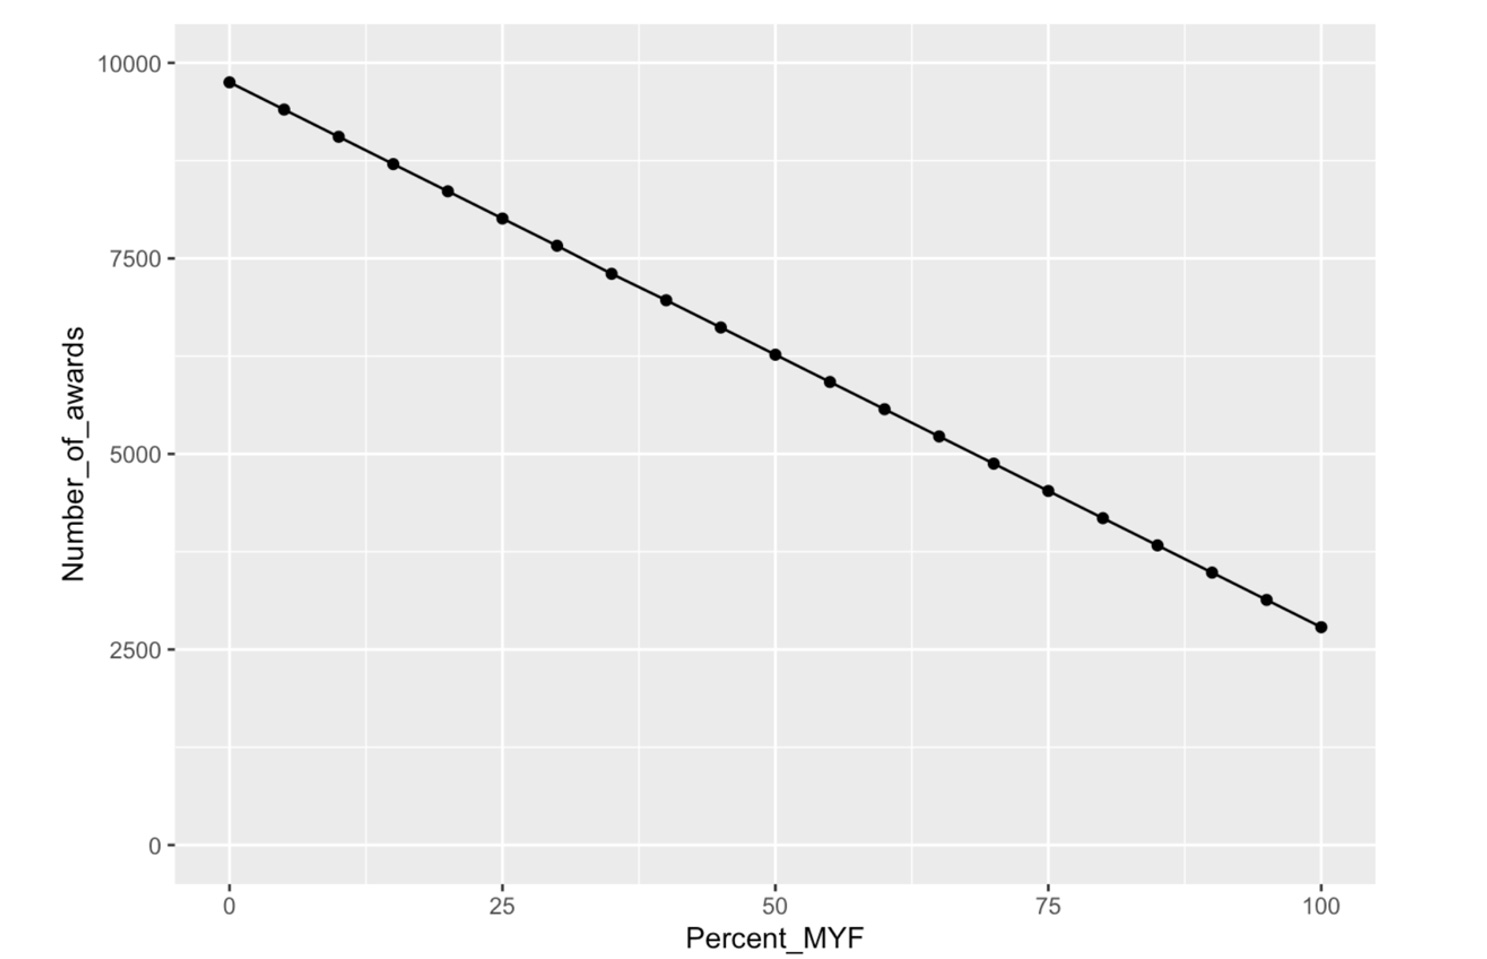
With this assumption, we can estimate the number of new and competitive renewal grants as a function of the percentage of funds for competitive grants devoted to multiyear funding as shown in Figure 11.
The administration had originally stated that its intention was to use 50% of the funds available for new and competing grants. However, in the appropriations bill that passed the Senate appropriation subcommittee, there was an amendment introduced by Senator Capito from West Virginia and Senator Baldwin from Wisconsin that would have restricted the amount of multiyear funding in fiscal year 2026 to fiscal year 2024 levels. In the negotiations for the “minibus” appropriations bill that includes NIH but also some other agencies, the House and Senate conference modified this to restrict multiyear funding to fiscal year 2025 levels, apparently at the insistence of the Office of Management and Budget led by Russ Vought.
If we take the level of multiyear funding in fiscal year 2024 as the baseline included in the model, the percentage increase is 30.1 – 16.2 = 13.9%. From Figure 11, this corresponds to a loss of approximately 970 new and competing grants that would be funding in fiscal year 2026. This represents projects delayed or lost, investigators unfunded, and institutions stressed.
Note that Congress could mitigate this damage by increasing the NIH appropriation. My models yield estimates that a 4% increase in the NIH appropriation would enable multiyear funding to be used without a loss of the number of funded new and competing grants. However, even a flat budget results is an estimated 2.7% loss in purchasing power based on BRDPI. Thus, a 6.7% increase would enable both the loss of buying power due to inflation and a loss of the number of awards due to multiyear funding.
This push to inflict this damage on the scientific enterprise raises the question as to why this appears to be such a priority of the administration. Insight comes from Project 2025, of which Russ Vought was a chief architect. A section on NIH reads as follows:
Funding for scientific research should not be controlled by a small group of highly paid and unaccountable insiders at the NIH, many of whom stay in power for decades. The NIH monopoly on directing research should be broken. Term limits should be imposed on top career leaders at the NIH, and Congress should consider block granting NIH’s grants budget to states to fund their own scientific research. Nothing in this system would prevent several states from partnering to co-fund large research projects that require greater resources or impact larger regions. Likewise, the establishment of funding for scientific research at the state level does not preclude more modest federal funding through the National Institutes of Health: The two models are not mutually exclusive.
The second section speaks to pushing Congress to convert NIH, at least largely, into a block grant program. This transition would be facilitated by the NIH having a relatively clean slate with relatively few commitments going into some fiscal year. This would be facilitated by increased use of multiyear funding. A block grant would require the generation of systems for allocation of funds to the individual states, the development of a system for application submission and review at each state, ideally coordination of research across states, and so on. The NIH is certainly not perfect and thoughtful reforms would be welcome, but this ideologically-driven damage to what has been described by numerous legislators from both parties of the “crown jewel” of the federal government seems unwise.
Observations that this is the plan is provided by the first part of this section. At this point, through non-renewal of contracts, firings, reassignments, and coerced retirements, more than half of the 27 institute director positions are now open. The search processes to fill these positions differ dramatically from historical norms with no apparent input from expert scientists from outside the NIH and no substantial outreach to try to interest qualified candidates in applying for the positions.
Conclusion
The results from this analysis are summarized in Figure 12.
Success rates for NIH grant applications can be predicted relatively accurately from the history of NIH appropriations. Major drivers are the inflation-corrected appropriation and the number of competing applications which has tended to grow fairly monotonically, both in time of favorable and less favorable appropriations. A weakness in this analysis is the lack of data about the number of applications in fiscal year 2025 which is hard to predict given the unprecedented behavior by NIH in this year. Year-to-year commitments also play an important role. Funding more than one year of grants out of the appropriation for the year of the award reduces the number of new and competing awards that can be funded. Currently proposed policies are likely to lead to ~1000 (~10%) fewer new and competing grants being funded in fiscal year 2026 than would have been funded in years with historically normal levels of multiyear funding.
So, the current bill language says this: "The agreement notes that the fiscal year 2026 budget
submission states that in fiscal year 2026 NIH proposes to continue a fiscal year
2025 policy to reserve half of the agency's budget allocation for competing RPGs
for awards that fully fund their outyear commitments as part of the initial grant
obligation." The key phrase is competing awards. Of the NIH budget last year, roughly 7.3 billion was spent on "competing awards". In total there were roughly 12,000 projects, which was down from the 15,000 projects in FY24. Are we going to see a loss of another 1,000 new projects or something more like the 3000 new projects observed from FY24 to FY25?
Did the bill passed in the Senate tonight have any changes to the MYF language?